Summary Reports
Chances are that the issues found on your sites affect many of their web pages, but in reality it's the same issue over and over again.
In many cases, the affected code lies within a layout or a shared template, so fixing it once will remove this issue from hundreds or thousands of pages at once.
That's why the first screen you'll see when creating a new report is the Summary. This screen shows the main HTML and accessibility issues found on your checked site, grouped by their importance. You'll get a highlight of the main issues for each kind of check so you can focus on fixing them first, and a link to see the full lists of HTML and accessibility issues.
Also, for the HTML and accessibility checks, a progress bar shows the percentage of pages that passed all the checks. Your goal is to reach a 100% of web pages passing all checks.
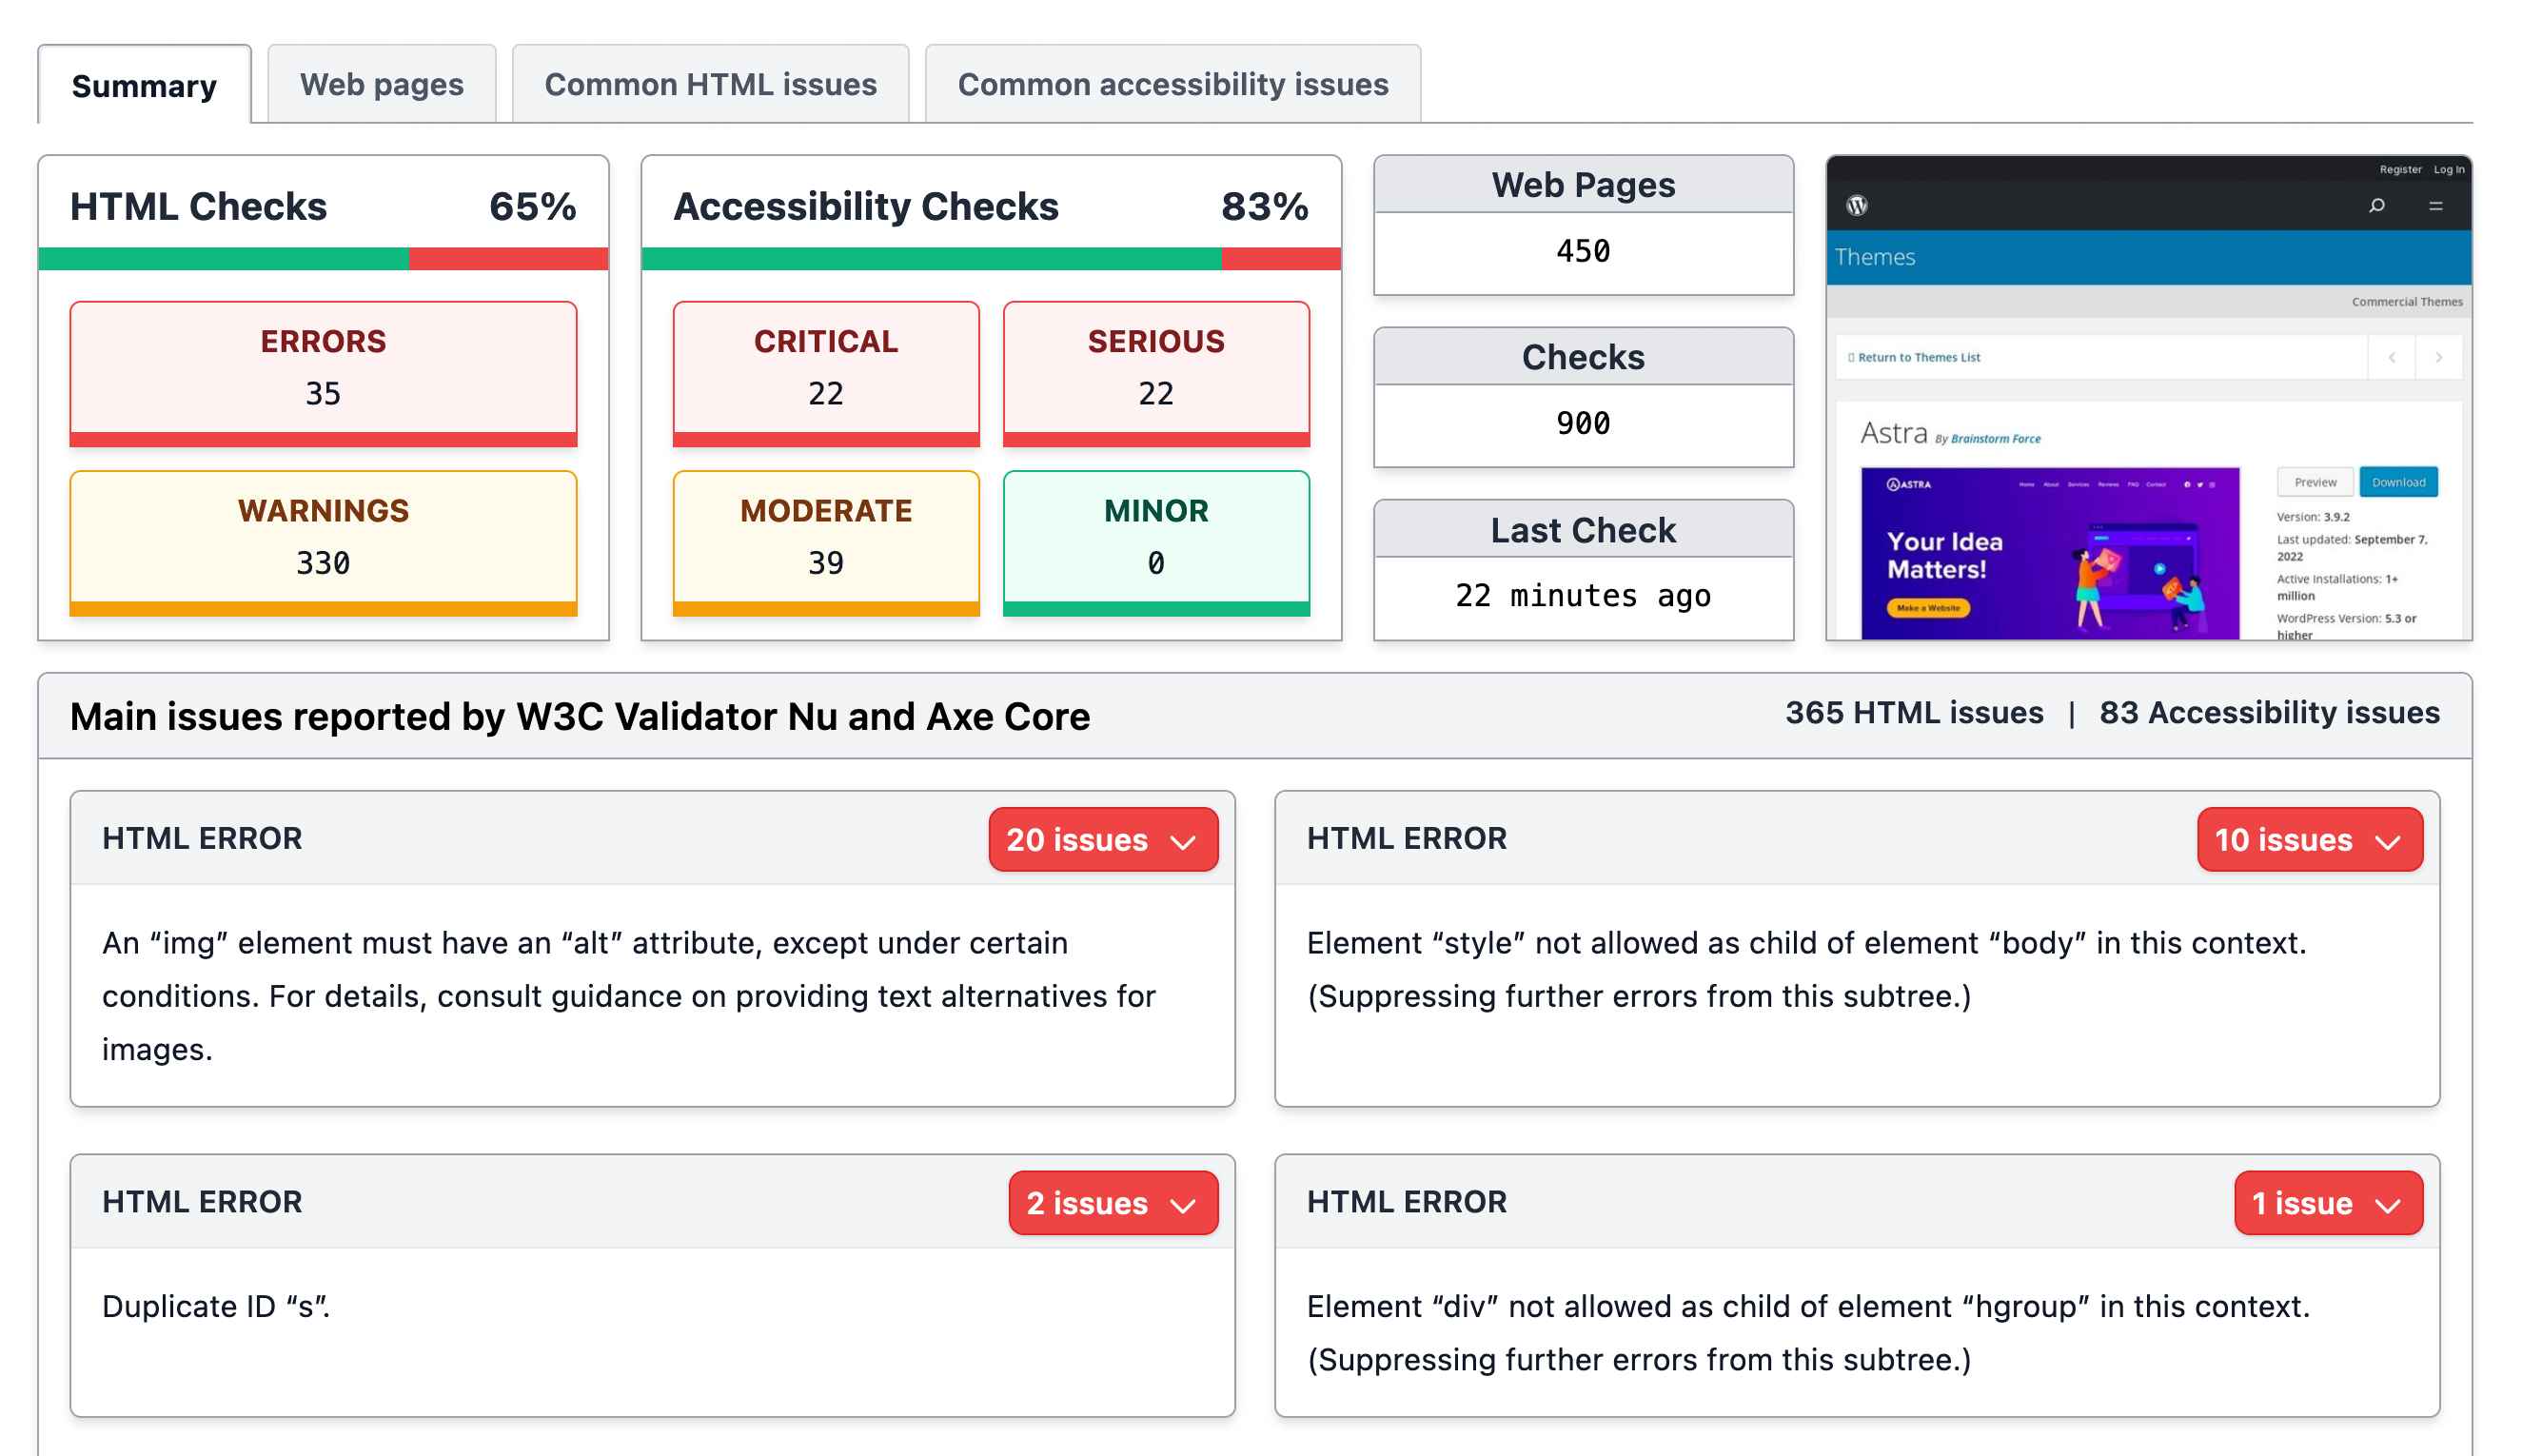
Common HTML / accessibility issues tabs
The Summary screen gives you the main issues for each kind of check. If you want to get the full list of issues, you can use the Common HTML issues or the Common accessibility issues tabs.
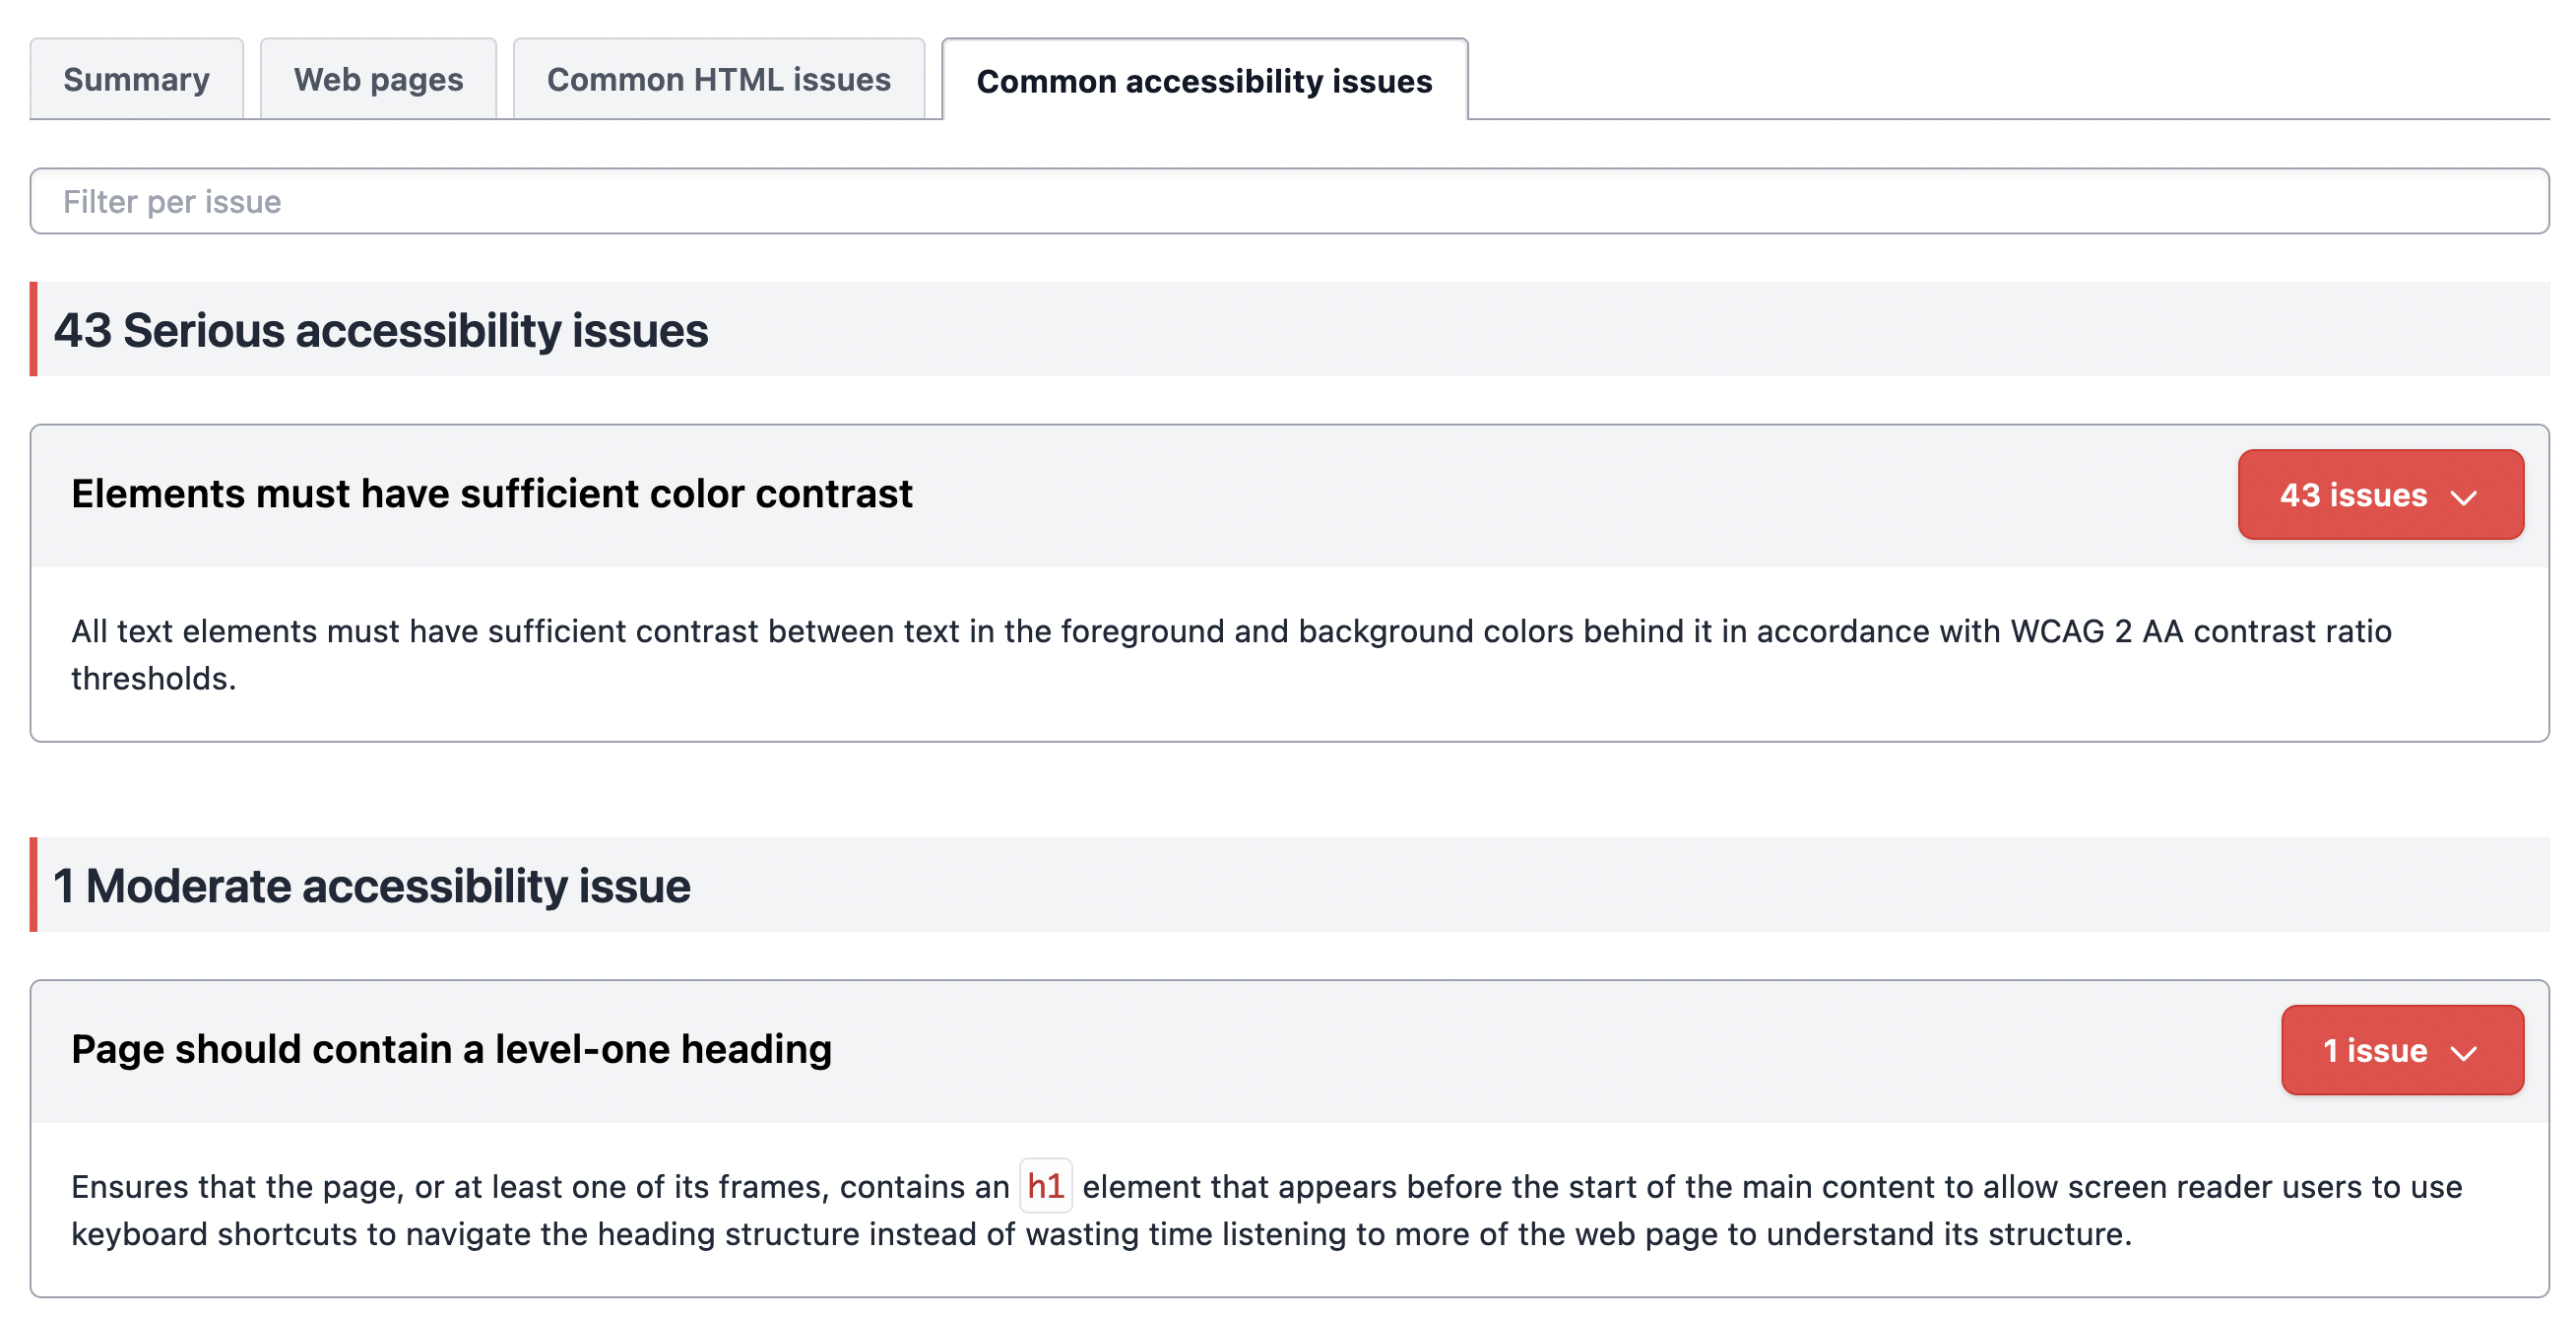
On the common issues reports you'll see all the issues found in all the web pages, grouped together and ordered by their frequency. For each issue, you can see how many web pages are affected by it.
The grouped issues are ordered by their severity and the number of web pages that it affects, so you can concentrate on fixing the most important issues first.
Seeing web pages affected
Each issue shows a contextual menu with the number of times it has been found on the site. Click on that menu and select Pages affected.
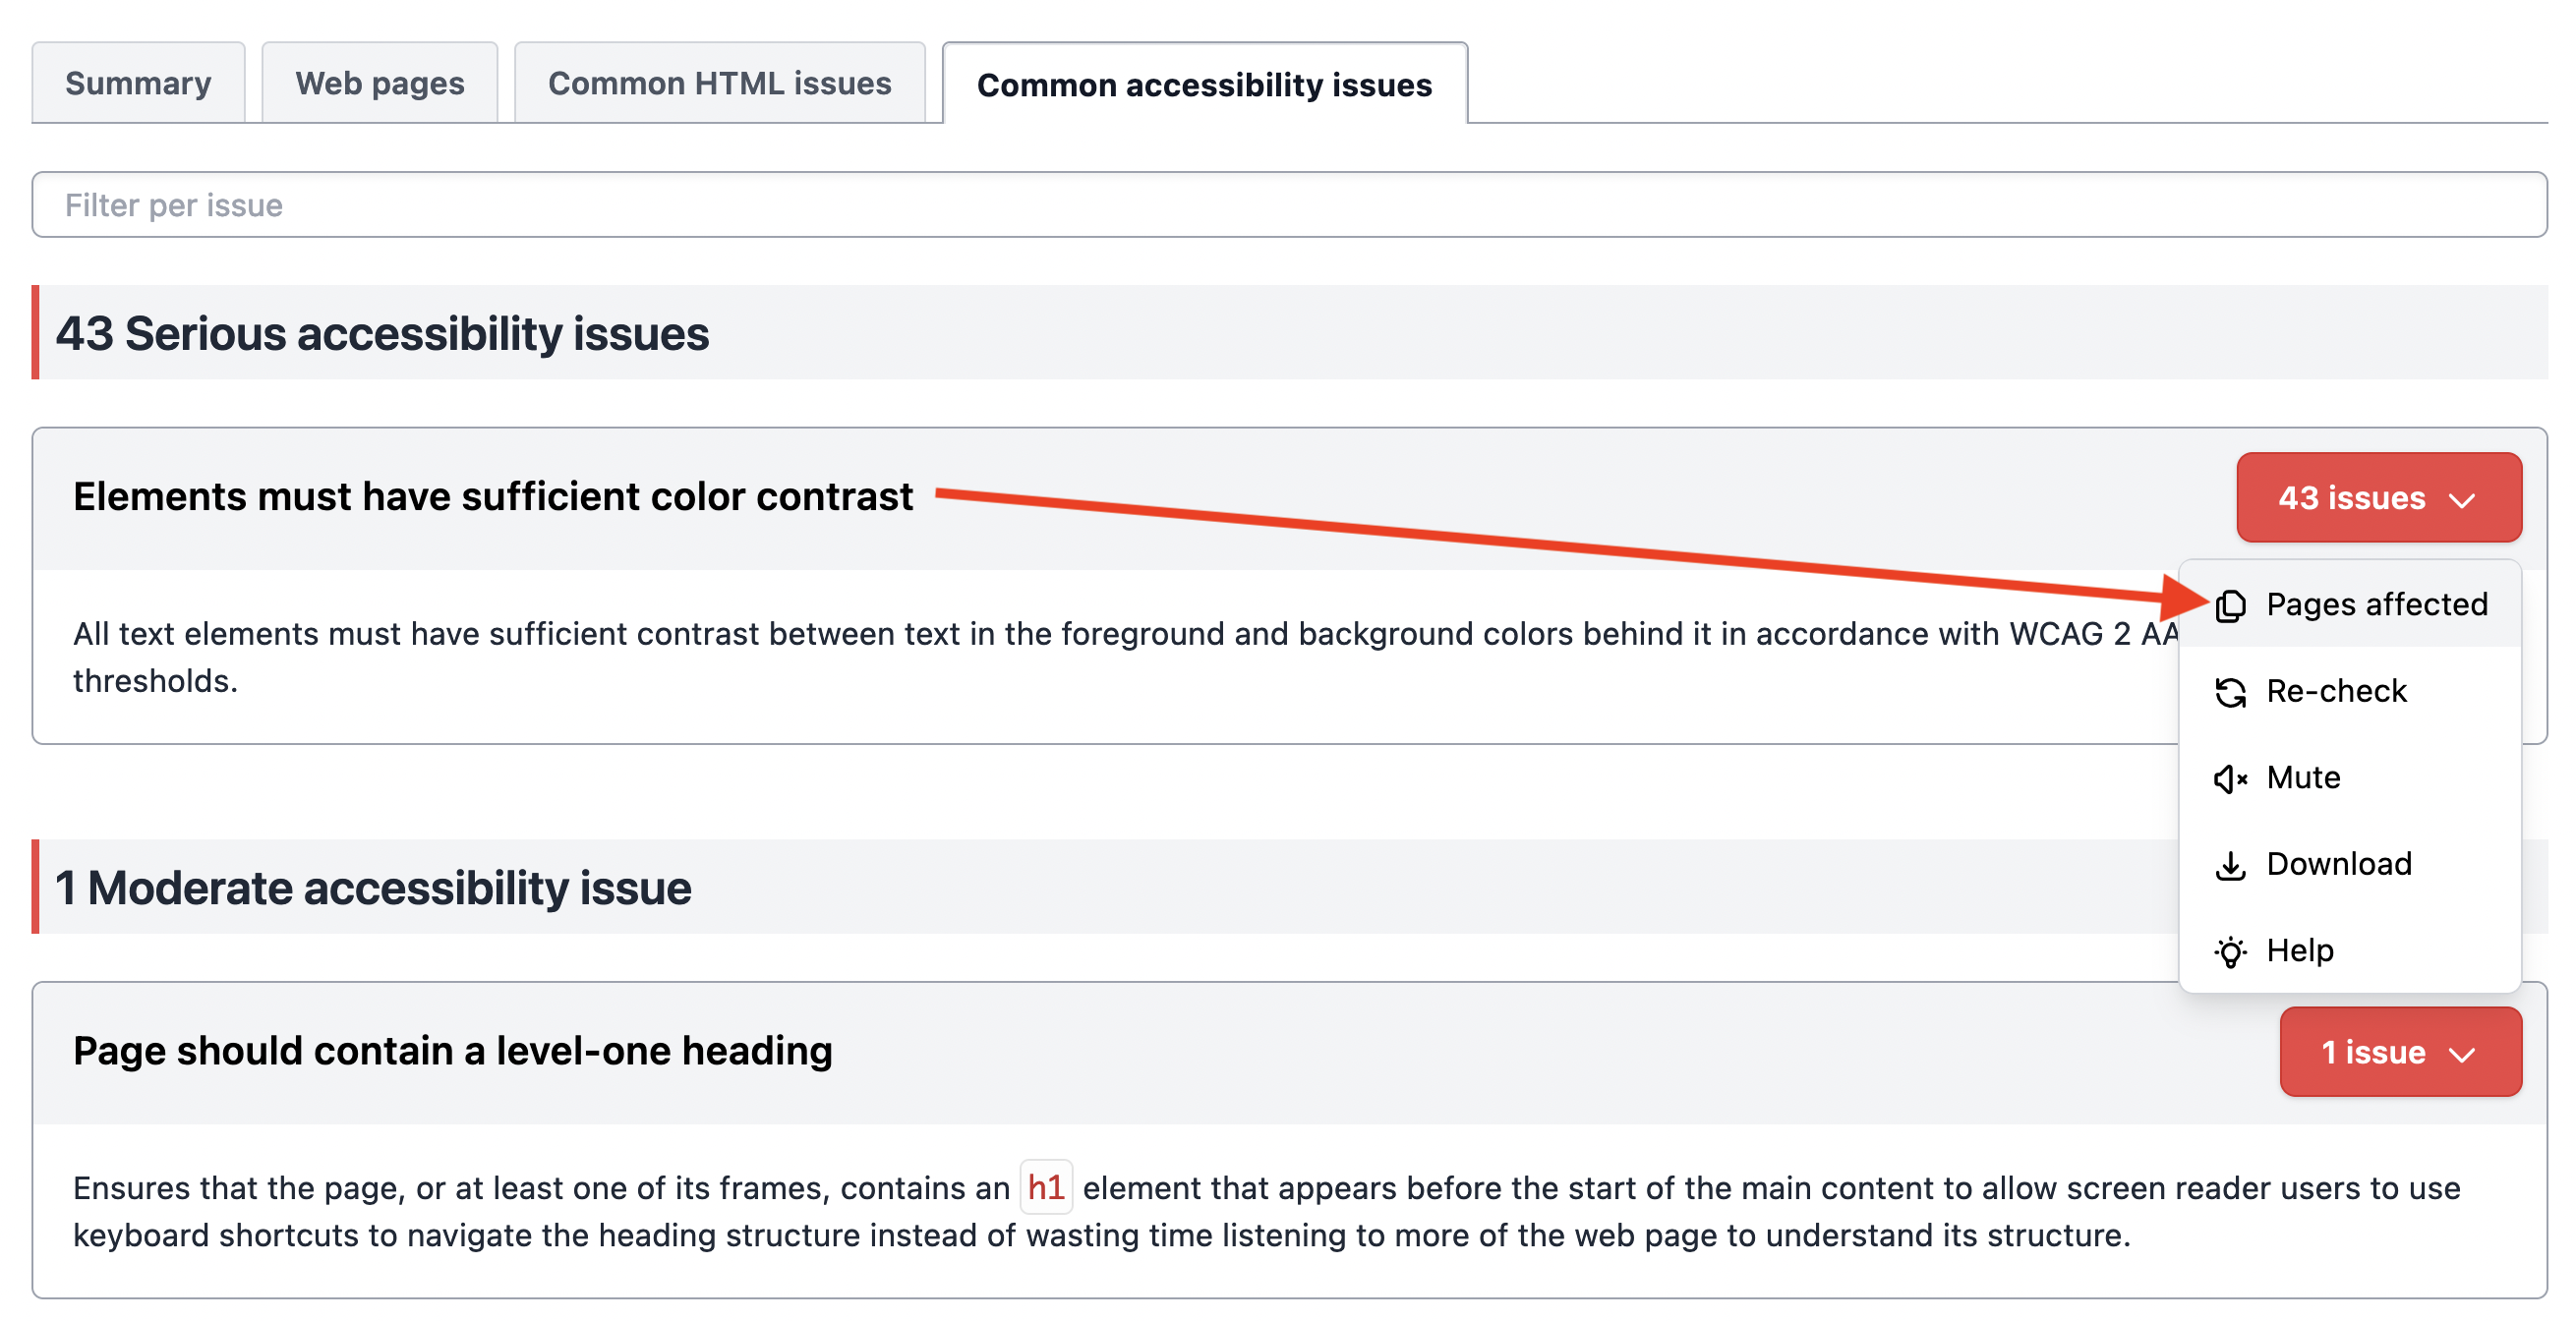
When you do that you'll see a list of the pages that have this exact issue. You can also filter per URL on that list.
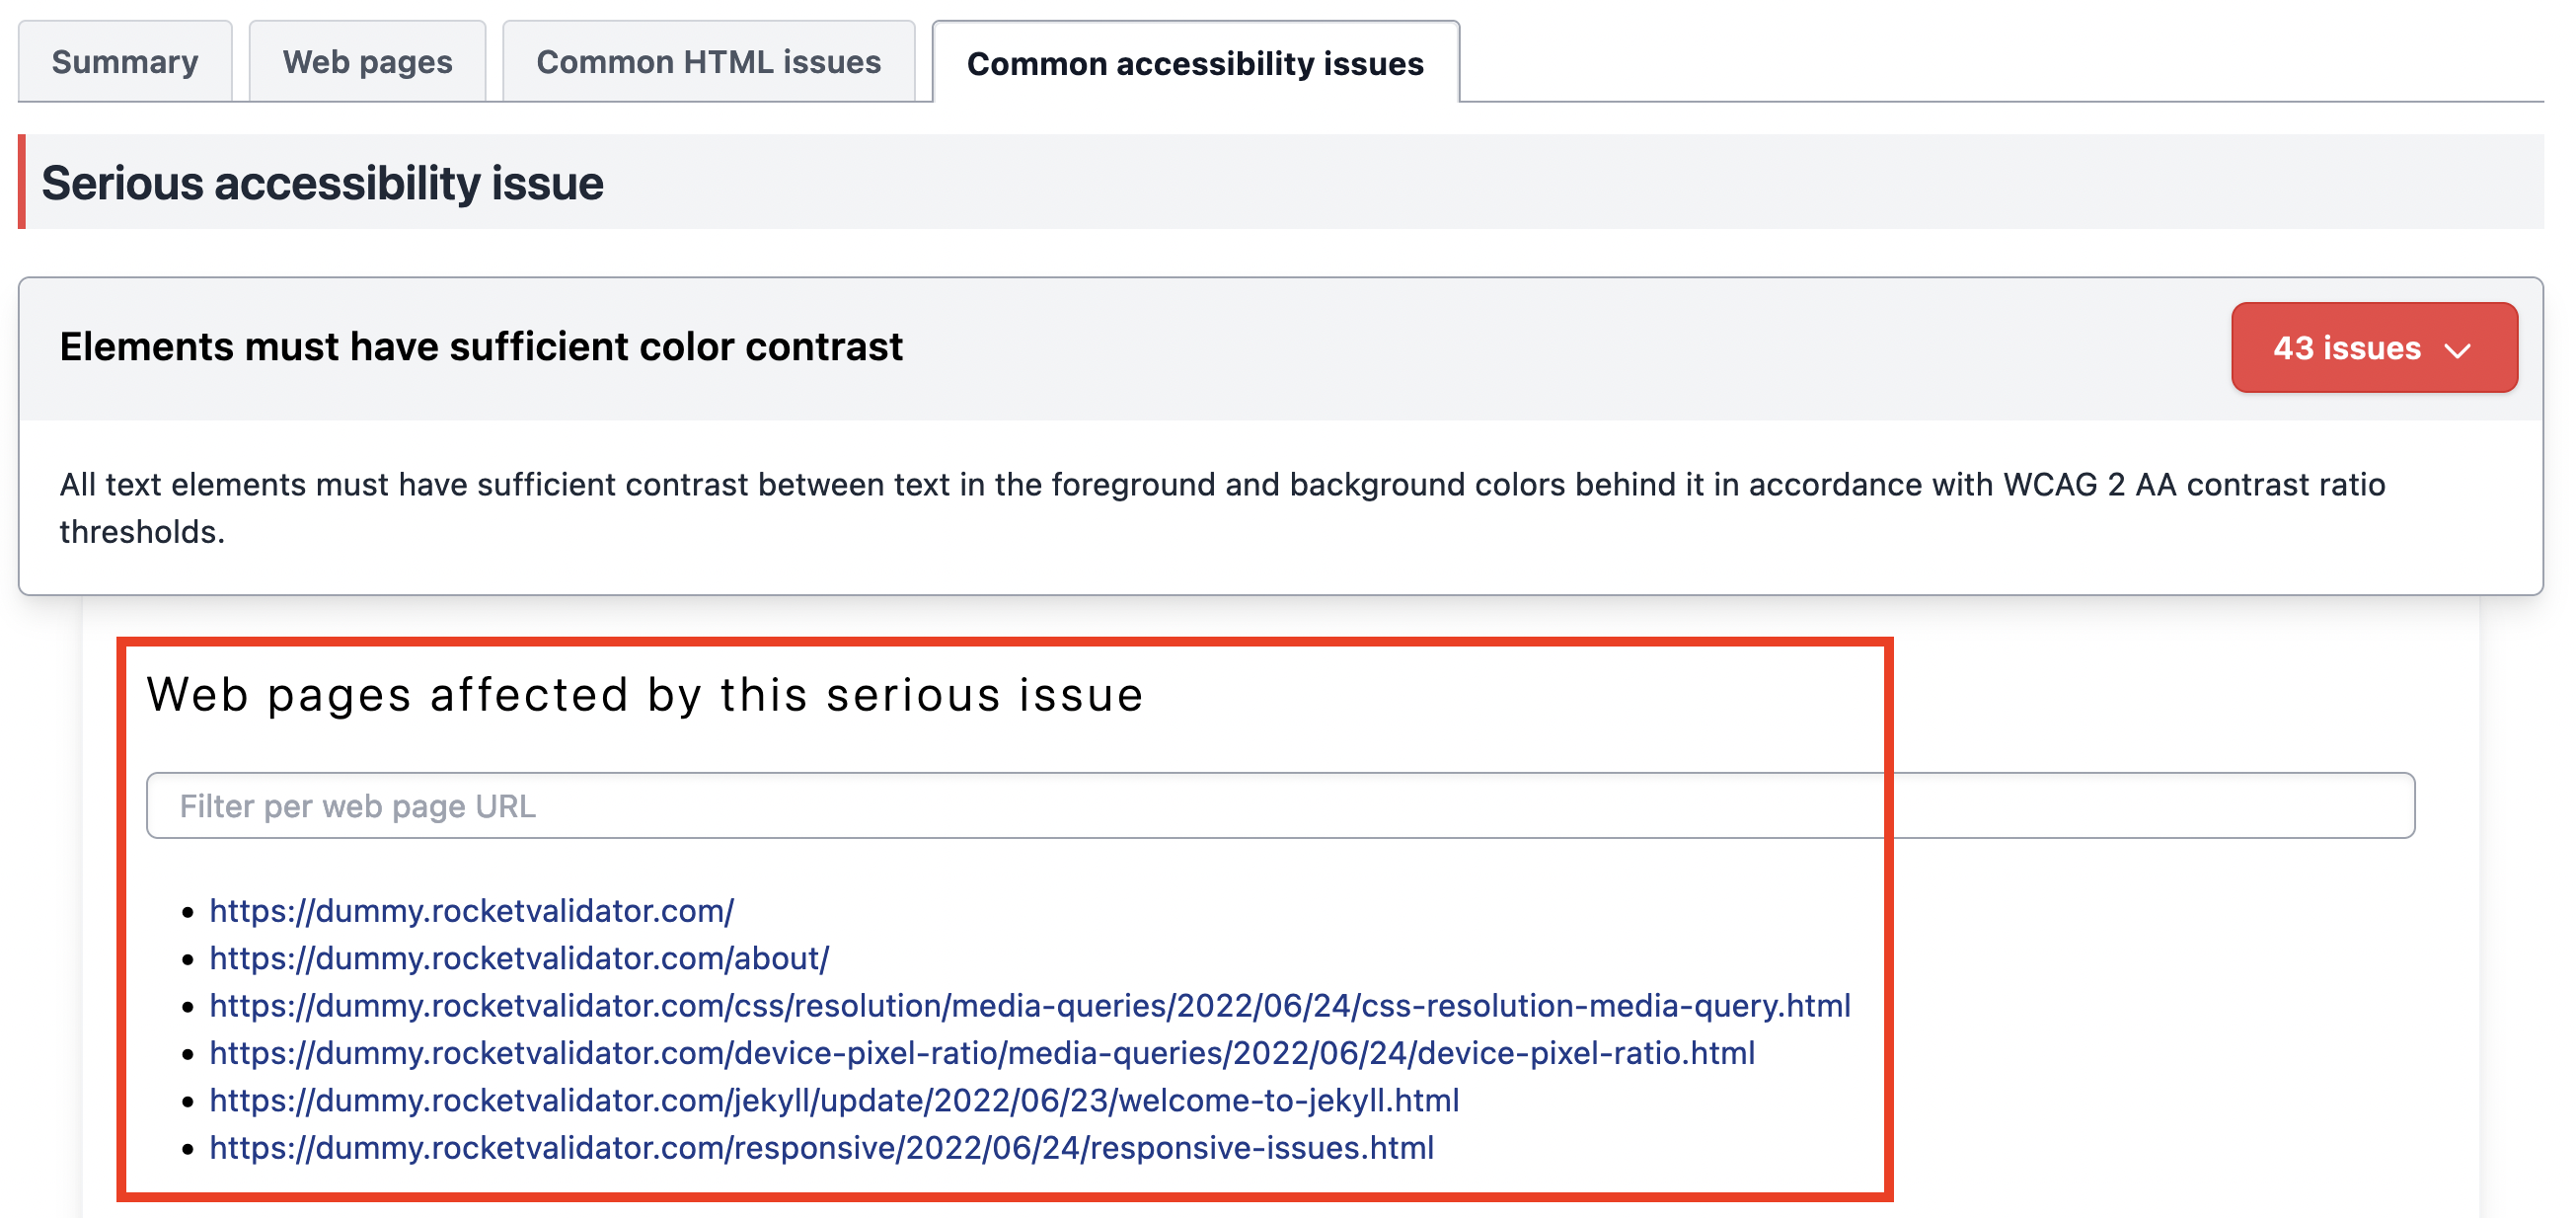
Once you've found and fixed this issue on your site, you can unfold the issue menu and click on "Re-check" to re-check all the web pages affected by this particular issue.
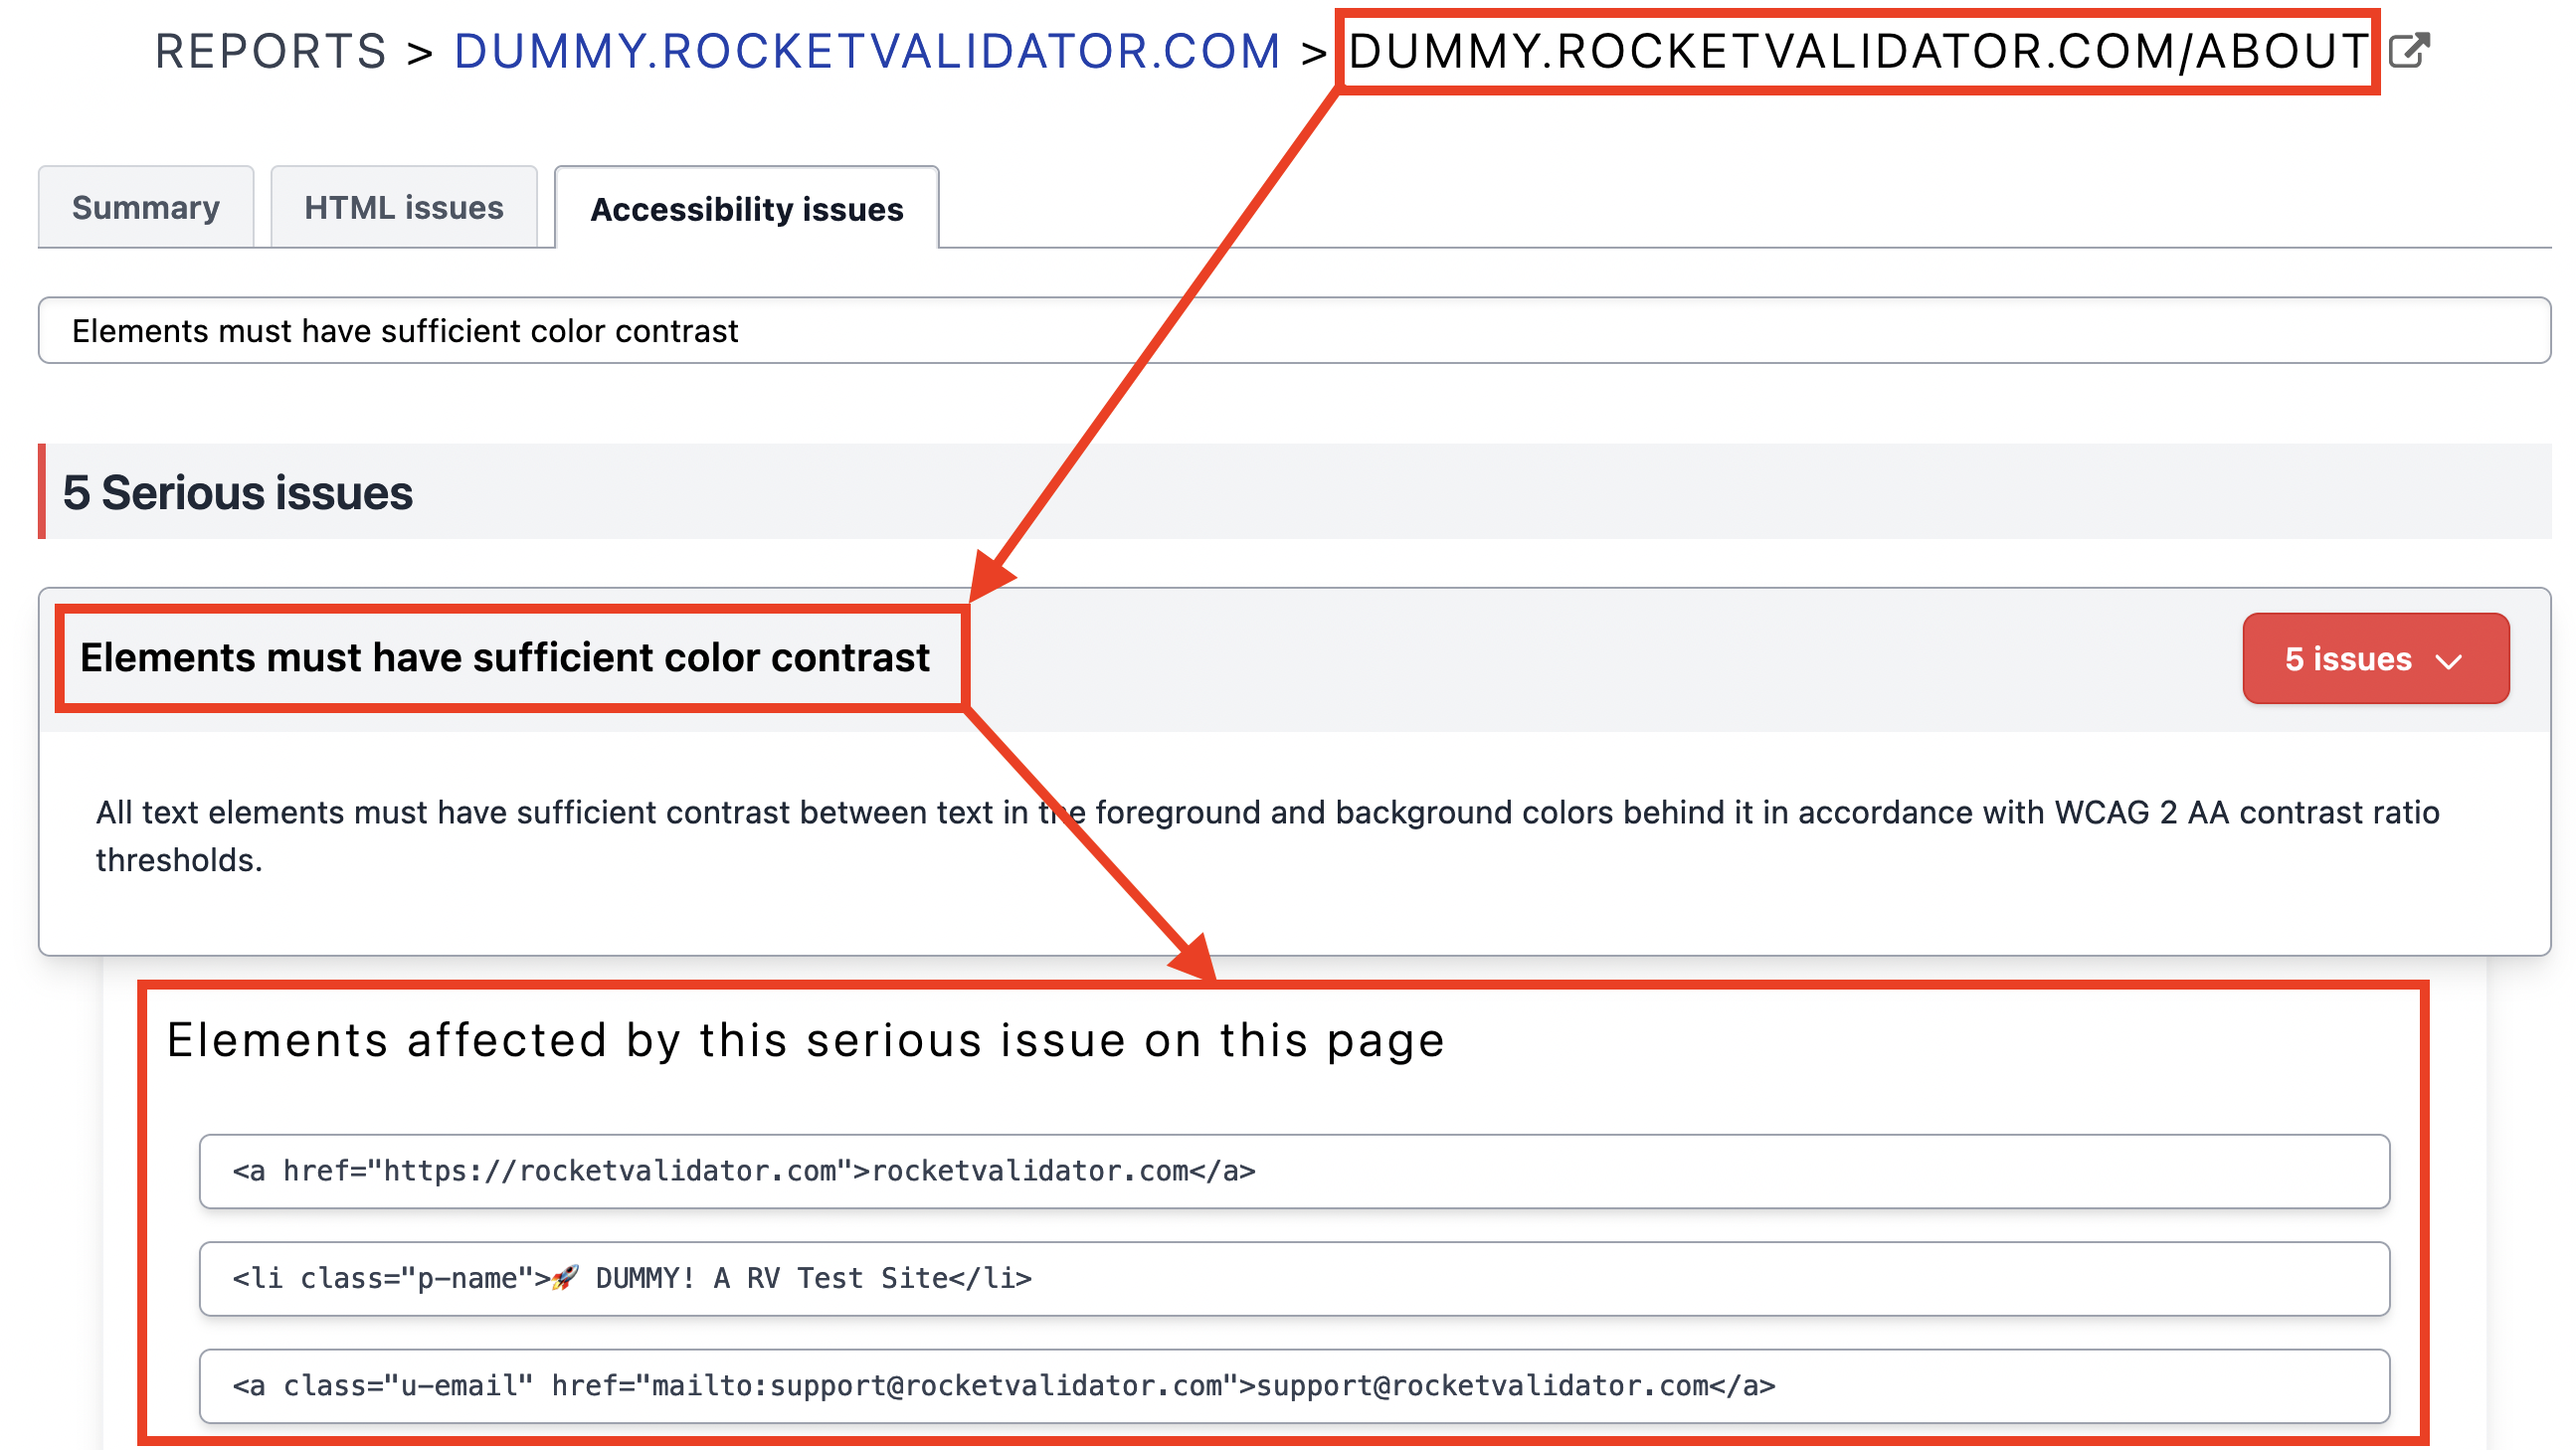
Issue on a given web page
You can also click on one of the affected pages to see where this issue happens exactly in the web page.
For HTML checks, you get the exact line in the source code where this issue has been found, click on the line button to jump to the exact line in the HTML source code viewer.
For A11Y checks, you'll get the DOM element affected by the issue.
